1.6 - Fieldwork Tracking Tools
Managing a field team requires real-time oversight. The Mozaic Earth dashboard provides a centralised "Command Centre" to track progress, manage workloads, and ensure that no data point is missed during the collection phase.
1.6.1 - Mastering the Map Filters
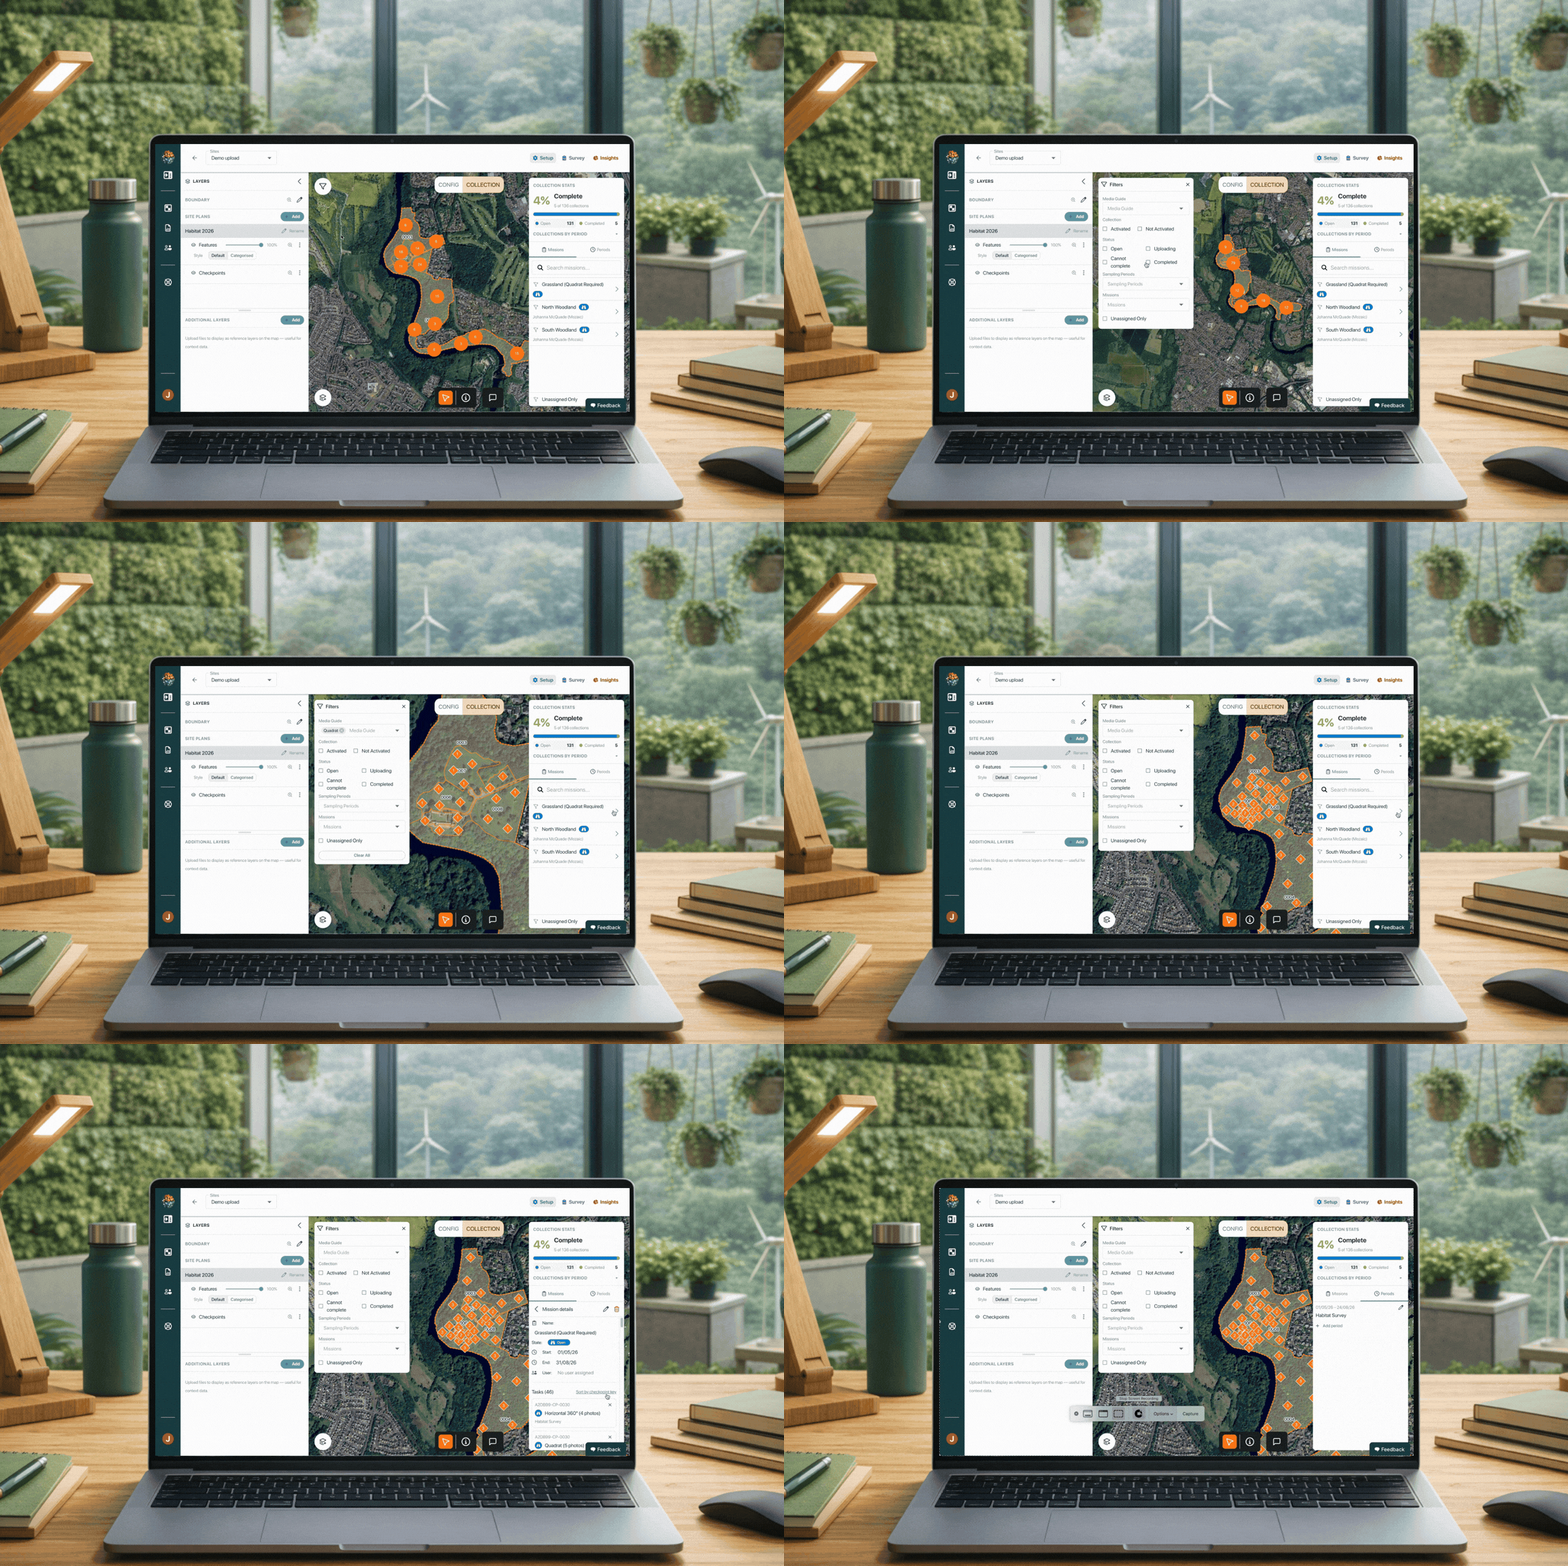
The map can become crowded during large-scale projects with many checkpoints. Use the filters to isolate exactly what you need to see. Click the Filter icon in the top left-hand corner of the page to get started.
-
Task Type Filtering: Filter by task type by clicking the media guide drop-down menu. This removes all other checkpoints from view, allowing you to audit the density and location of specific data types.
-
Sampling Periods: If your project has multiple phases, you can create multiple sampling periods (e.g. Spring & Autumn) when activating checkpoints. If you have set sampling periods, use this to filter the data display by season.
-
Mission View: If you have created missions for data collection, use the Missions drop-down to toggle the visibility of specific missions. This helps you visualise the geographic area assigned to individual missions.
| Metric | What it tells you |
|---|---|
| Activated | Shows all checkpoints that have been Activated. These are live and ready for data collection. |
| Not Activated | Shows checkpoints that have not yet been activated. Important: These will not be visible to surveyors on the mobile app. |
| Open | Shows checkpoints that are active but have not yet been completed in the field. |
| Uploading | Shows checkpoints that have been completed by the data collector on the app but have not yet been uploaded from the user's device. |
| Cannot Complete | Shows checkpoints that have been marked as inaccessible by a user in the field. |
| Completed | Shows checkpoints that have been completed and uploaded by the data collector and are visible on Mozaic OS. |
1.6.2 - Collection Stats: Real-Time Progress Tracking
To keep your project on schedule, use the Collection Stats menu to view high-level completion data across the entire site.
You can see the completion percentage for how many tasks have been finished across the site per plan. You can also view the total number of tasks for each status (Open / Pending Upload / Complete) to see exactly how much is left to complete in the field.
Collections by Period: A breakdown of "Open" vs. "Complete" tasks per defined sampling window. This is essential for identifying if a specific season is falling behind.
1.6.3 - Mission Management & Field Oversight
Missions allow you to group tasks and assign them to specific users or dates.
-
Drill-Down Data: Select the arrow next to a mission name to view the unique IDs for every task and checkpoint allocated to that mission.
-
Live Editing: Edit the mission name, change the assigned user, or update the deadline dates on the fly to respond to changing field conditions.
-
Tracking Icons (By Mission or Per Task)
-
Open (Binoculars Icon): The mission or checkpoint is active but not yet finished.
-
Pending Upload (Upload Icon): The mission or checkpoint has been completed in the field, but the data is still pending upload from the data collector's device.
-
Complete (Tick Icon): The surveyor has finalised the mission or task, and the data is fully synced.
-